
Ingram Micro Holding Corporation
INGMTechnology · Stock · quarterly payer
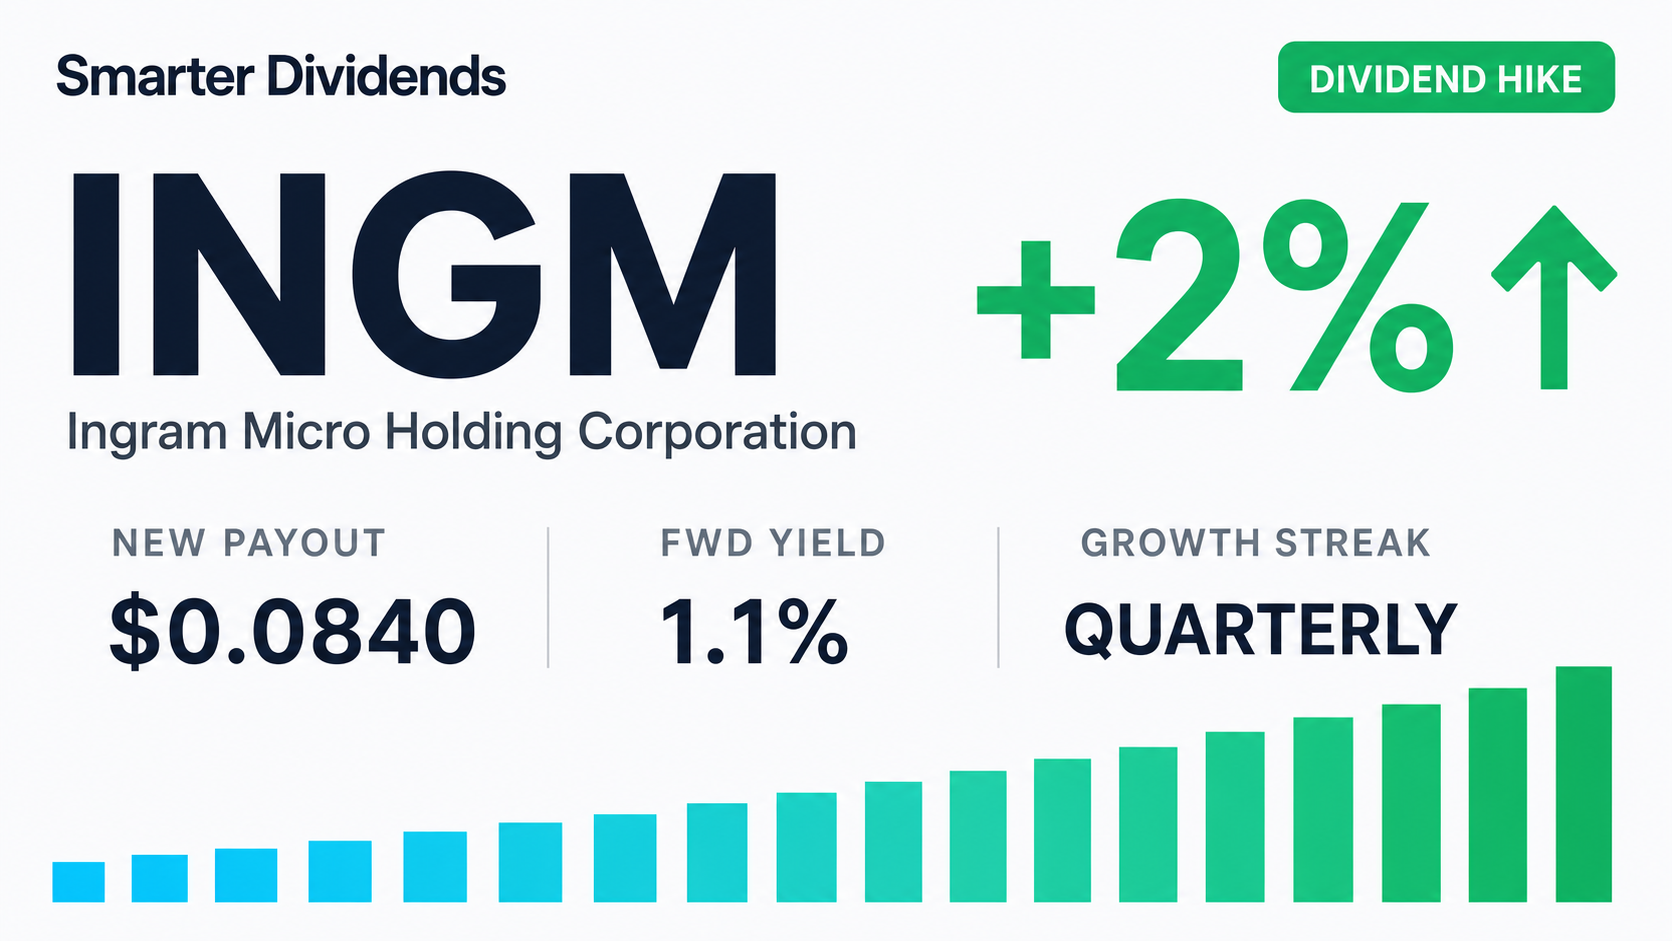
Forward Yield
1.11%
Annual Dividend
$0.32
Payout Ratio
21%
5-Yr Growth
—
Ex-Date
May 12, 2026
Frequency
Quarterly
Is INGM a good dividend stock?
MixedIngram Micro Holding Corporation (INGM) pays a quarterly dividend yielding 1.11% ($0.32/yr), with 0 years of growth. The picture is mixed — the dividend pays, but safety or growth signals are weaker than ideal.
Advantages
- Never cut its dividend on record
- Comfortable payout ratio (21%)
Risks
- Single-stock concentration risk — diversify
Key Data
- Dividend Yield
- 1.11%
- Payout Ratio
- 21%
- Annual Dividend
- $0.32
- 5-Yr Avg Growth
- —
- Ex-Dividend Date
- May 12, 2026
- Years of Growth
- 0
- Frequency
- quarterly
- Beta
- —
- Market Cap
- $6.7B
- P/E Ratio
- 19.2
- 5-Yr Total Return
- —
- 52-Week Range
- $18.09 – $31.69
- Dividend Safety
- —
- Ever Cut?
- No
Frequently Asked Questions
INGM Price — Last 12 Months
Daily close
Price Return
1 Year
+42%
3 Years
—
5 Years
—
52-Week Range
$18.09 – $31.69
Price change over each period (excludes dividends). Past performance doesn't guarantee future results.
What is INGM worth?
Undervaluedlow confidenceOur blended fair-value estimate for Ingram Micro Holding Corporation is $66.58 per share, versus a market price of $29.13. That implies 129% of upside — a margin of safety of about 56%.
Fair Value
$66.58
Current Price
$29.13
Upside
+129%
Margin of Safety
56%
How we get there
Discounted cash flow
Discounts projected free cash flow back to today.
Earnings multiple (Graham)
Graham's earnings-multiple formula, anchored to bond yields.
At today's price, the market is pricing in about -2.1% annual free-cash-flow growth. We model 15.3% — below our estimate, leaving room for upside if the business executes.
Assumptions: 9.3% discount rate (CAPM), 15.3% stage-1 growth, 2.5% terminal growth, $1.52 EPS, $0.32 annual dividend. Updated weekly.
Fair-value estimates are model output for educational purposes only — not investment advice or a price target.
Dividend History
| Ex-Date | Pay Date | Amount | Type |
|---|---|---|---|
| May 12, 2026 | — | $0.0840 | regular |
| Mar 10, 2026 | — | $0.0820 | regular |
| Nov 10, 2025 | — | $0.0800 | regular |
| Aug 19, 2025 | — | $0.0780 | regular |
| May 20, 2025 | — | $0.0760 | regular |
| Mar 11, 2025 | — | $0.0740 | regular |
Income Calculator
At $0.32 / yr per share