
Morgan Stanley Emerging Markets Domestic Debt Fund, Inc.
EDDFinancial Services · Stock · quarterly payer
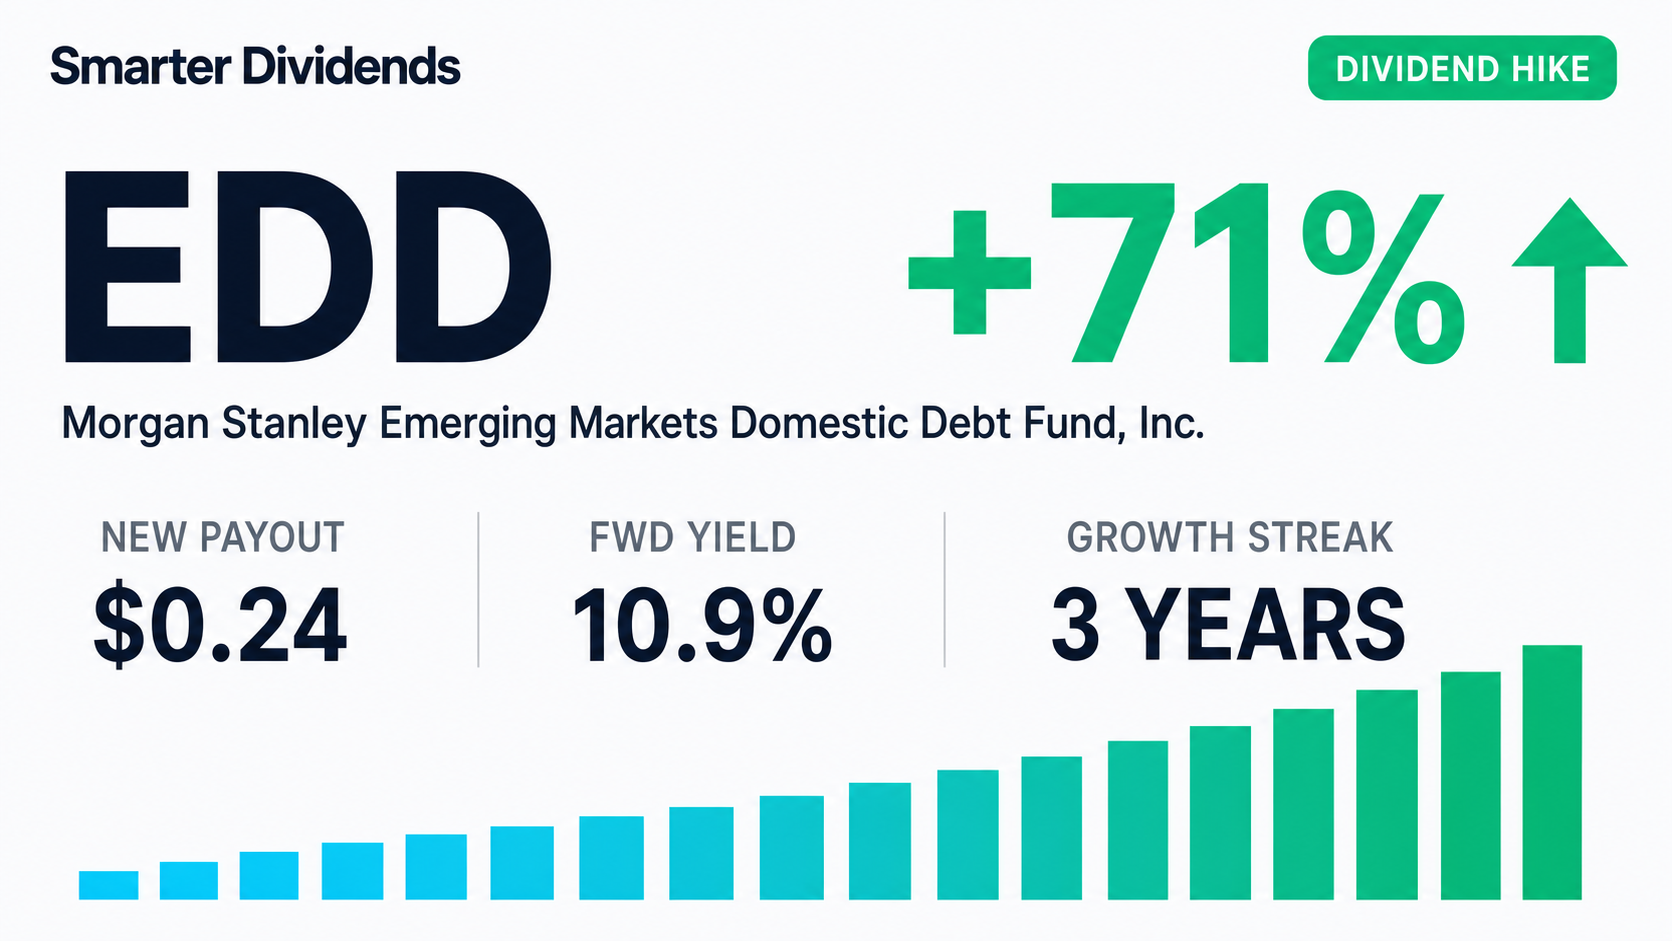
Forward Yield
10.90%
Annual Dividend
$0.63
Payout Ratio
42%
5-Yr Growth
4.0%
Ex-Date
Jun 30, 2026
Frequency
Quarterly
Summary
As of July 2026, Morgan Stanley Emerging Markets Domestic Debt Fund, Inc. (EDD) yields 10.90% ($0.63 per share annually), with a blended fair-value estimate of $11.77 — +99% upside, so it screens as undervalued. Dividend safety grade: C (57/100). 3 years of dividend growth.
Is EDD a good dividend stock?
MixedMorgan Stanley Emerging Markets Domestic Debt Fund, Inc. (EDD) pays a quarterly dividend yielding 10.90% ($0.63/yr), with 3 years of growth and a dividend-safety grade of C. The picture is mixed — the dividend pays, but safety or growth signals are weaker than ideal.
Advantages
- Comfortable payout ratio (42%)
Risks
- Cut its dividend in 2025
- Very high yield can signal elevated risk
- Share price is down over the past 5 years
Key Data
- Dividend Yield
- 10.90%
- Payout Ratio
- 42%
- Annual Dividend
- $0.63
- 5-Yr Avg Growth
- 4.0%
- Ex-Dividend Date
- Jun 30, 2026
- Years of Growth
- 3
- Frequency
- quarterly
- Beta
- —
- Market Cap
- $372.6M
- P/E Ratio
- 4.8
- 5-Yr Total Return
- -5%
- 52-Week Range
- $4.96 – $6.18
- Dividend Safety
- C · 57/100
- Ever Cut?
- Yes (2025)
Frequently Asked Questions
EDD Price — Last 12 Months
Daily close
Price Return
1 Year
+16%
3 Years
+21%
5 Years
-5%
52-Week Range
$4.96 – $6.18
Price change over each period (excludes dividends). Past performance doesn't guarantee future results.
What is EDD worth?
Undervaluedlow confidenceOur blended fair-value estimate for Morgan Stanley Emerging Markets Domestic Debt Fund, Inc. is $11.77 per share, versus a market price of $5.91. That implies 99% of upside — a margin of safety of about 50%.
Fair Value
$11.77
Current Price
$5.91
Upside
+99%
Margin of Safety
50%
How we get there
Dividend discount
Discounts the future dividend stream back to today.
Earnings multiple (Graham)
Graham's earnings-multiple formula, anchored to bond yields.
Assumptions: 9.3% discount rate (CAPM), 3.1% stage-1 growth, 2.5% terminal growth, $1.06 EPS, $0.63 annual dividend. Updated weekly.
Fair-value estimates are model output for educational purposes only — not investment advice or a price target.
EDD Dividend Safety Score
Borderline
SmarterDividends' proprietary score, backtested against which dividends were actually cut over 15+ years (0.78 AUC). It blends a validated cut-risk model (growth streak, cut history) with current payout, cash-flow and debt. Higher is safer · not investment advice.
Dividend Growth
Total dividends per share by year
Dividend History
| Ex-Date | Pay Date | Amount | Type |
|---|---|---|---|
| Jun 30, 2026 | — | $0.2400 | regular |
| Mar 31, 2026 | — | $0.1400 | regular |
| Dec 19, 2025 | — | $0.1300 | regular |
| Sep 30, 2025 | — | $0.1200 | regular |
| Jun 30, 2025 | — | $0.1200 | regular |
| Mar 31, 2025 | — | $0.1600 | regular |
| Dec 13, 2024 | — | $0.1600 | regular |
| Sep 30, 2024 | — | $0.1350 | regular |
| Jun 28, 2024 | — | $0.1350 | regular |
| Mar 27, 2024 | — | $0.0900 | regular |
| Dec 14, 2023 | — | $0.0900 | regular |
| Sep 28, 2023 | — | $0.0900 | regular |
| Jun 29, 2023 | — | $0.0800 | regular |
| Mar 30, 2023 | — | $0.0800 | regular |
Income Calculator
At $0.63 / yr per share