
First Financial Bankshares, Inc.
FFIN32 yrs growthFinancial Services · Stock · quarterly payer
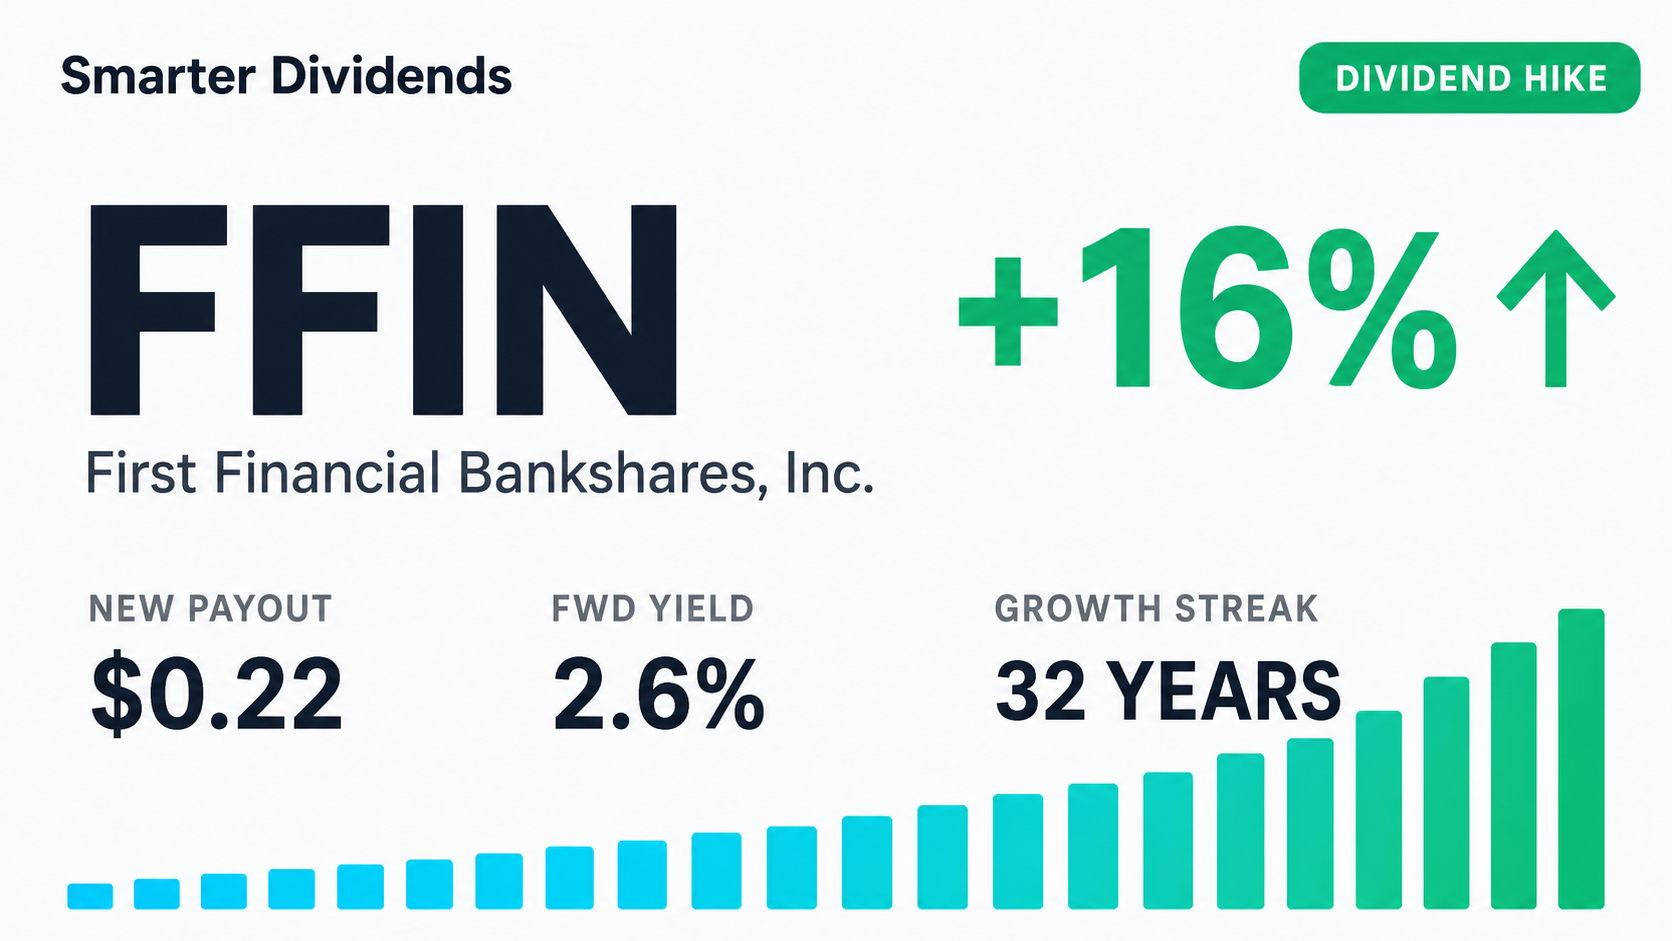
Forward Yield
2.61%
Annual Dividend
$0.88
Payout Ratio
41%
5-Yr Growth
7.9%
Ex-Date
Jun 12, 2026
Frequency
Quarterly
Is FFIN a good dividend stock?
YesFirst Financial Bankshares, Inc. (FFIN) pays a quarterly dividend yielding 2.61% ($0.88/yr), with 32 years of growth and a dividend-safety grade of A. It scores well across payout coverage, growth history and safety — a dependable income holding.
Advantages
- Dividend Aristocrat — 32 consecutive years of growth
- Never cut its dividend on record
- Comfortable payout ratio (41%)
- Strong 7.9% 5-yr dividend growth
- Top-tier dividend safety score
Risks
- Share price is down over the past 5 years
Key Data
- Dividend Yield
- 2.61%
- Payout Ratio
- 41%
- Annual Dividend
- $0.88
- 5-Yr Avg Growth
- 7.9%
- Ex-Dividend Date
- Jun 12, 2026
- Years of Growth
- 32
- Frequency
- quarterly
- Beta
- 0.84
- Market Cap
- $4.8B
- P/E Ratio
- 18.3
- 5-Yr Total Return
- -32%
- 52-Week Range
- $28.12 – $38.74
- Dividend Safety
- A · 94/100
- Ever Cut?
- No
Frequently Asked Questions
FFIN Price — Last 12 Months
Daily close
Price Return
1 Year
-6%
3 Years
+18%
5 Years
-32%
52-Week Range
$28.12 – $38.74
Price change over each period (excludes dividends). Past performance doesn't guarantee future results.
What is FFIN worth?
Undervaluedmedium confidenceOur blended fair-value estimate for First Financial Bankshares, Inc. is $50.69 per share, versus a market price of $33.65. That implies 51% of upside — a margin of safety of about 34%.
Fair Value
$50.69
Current Price
$33.65
Upside
+51%
Margin of Safety
34%
How we get there
Discounted cash flow
Discounts projected free cash flow back to today.
Dividend discount
Discounts the future dividend stream back to today.
Earnings multiple (Graham)
Graham's earnings-multiple formula, anchored to bond yields.
At today's price, the market is pricing in about 0.8% annual free-cash-flow growth. We model 15.7% — below our estimate, leaving room for upside if the business executes.
Assumptions: 8.5% discount rate (CAPM), 15.7% stage-1 growth, 2.5% terminal growth, $1.84 EPS, $0.88 annual dividend. Updated weekly.
Fair-value estimates are model output for educational purposes only — not investment advice or a price target.
FFIN Dividend Safety Score
Very Safe
SmarterDividends' proprietary score, backtested against which dividends were actually cut over 15+ years (0.78 AUC). It blends a validated cut-risk model (growth streak, cut history) with current payout, cash-flow and debt. Higher is safer · not investment advice.
Dividend Growth
Total dividends per share by year
Dividend History
| Ex-Date | Pay Date | Amount | Type |
|---|---|---|---|
| Jun 12, 2026 | — | $0.2200 | regular |
| Mar 13, 2026 | — | $0.1900 | regular |
| Dec 15, 2025 | — | $0.1900 | regular |
| Sep 15, 2025 | — | $0.1900 | regular |
| Jun 16, 2025 | — | $0.1900 | regular |
| Mar 14, 2025 | — | $0.1800 | regular |
| Dec 13, 2024 | — | $0.1800 | regular |
| Sep 12, 2024 | — | $0.1800 | regular |
| Jun 14, 2024 | — | $0.1800 | regular |
| Mar 14, 2024 | — | $0.1800 | regular |
| Dec 14, 2023 | — | $0.1800 | regular |
| Sep 13, 2023 | — | $0.1800 | regular |
| Jun 14, 2023 | — | $0.1800 | regular |
| Mar 10, 2023 | — | $0.1700 | regular |
Income Calculator
At $0.88 / yr per share