
Invesco Ltd.
IVZFinancial Services · Stock · quarterly payer
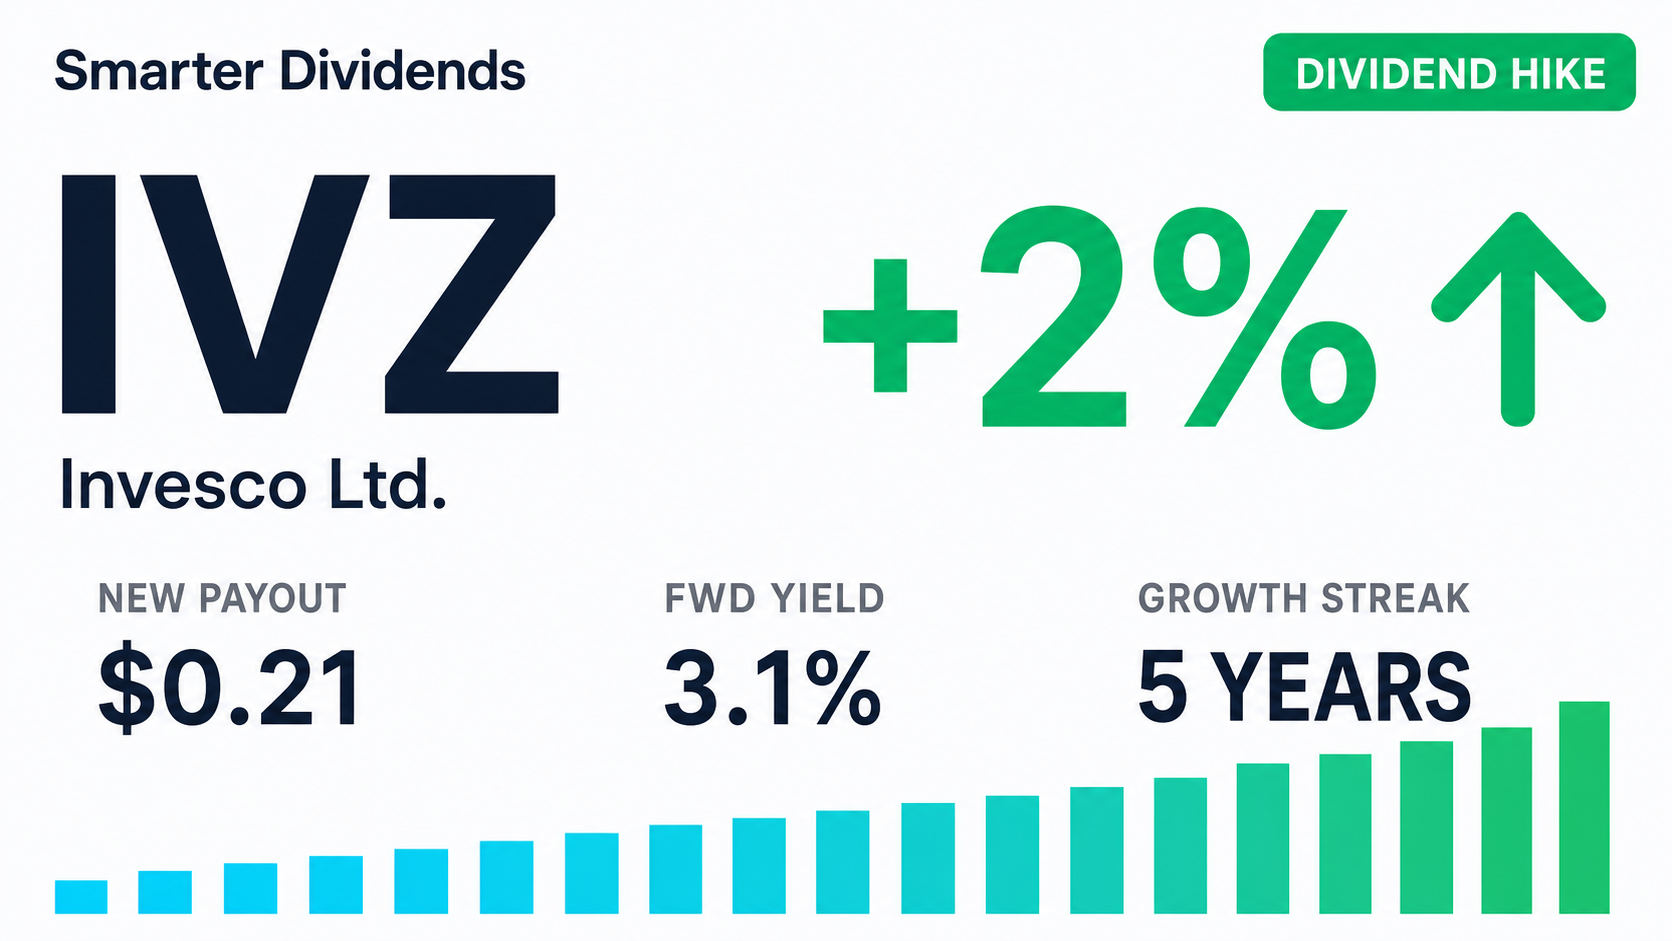
Forward Yield
3.13%
Annual Dividend
$0.86
Payout Ratio
56%
5-Yr Growth
6.3%
Ex-Date
May 15, 2026
Frequency
Quarterly
Is IVZ a good dividend stock?
Yes, with caveatsInvesco Ltd. (IVZ) pays a quarterly dividend yielding 3.13% ($0.86/yr), with 5 years of growth and a dividend-safety grade of B. It's a solid income payer, but check the caveats below before buying.
Advantages
- Comfortable payout ratio (56%)
- Strong 6.3% 5-yr dividend growth
Risks
- Cut its dividend in 2020
Key Data
- Dividend Yield
- 3.13%
- Payout Ratio
- 56%
- Annual Dividend
- $0.86
- 5-Yr Avg Growth
- 6.3%
- Ex-Dividend Date
- May 15, 2026
- Years of Growth
- 5
- Frequency
- quarterly
- Beta
- 1.59
- Market Cap
- $12.2B
- P/E Ratio
- —
- 5-Yr Total Return
- 2%
- 52-Week Range
- $14.17 – $29.61
- Dividend Safety
- B · 67/100
- Ever Cut?
- Yes (2020)
Frequently Asked Questions
IVZ Price — Last 12 Months
Daily close
Price Return
1 Year
+73%
3 Years
+63%
5 Years
+2%
52-Week Range
$14.17 – $29.61
Price change over each period (excludes dividends). Past performance doesn't guarantee future results.
What is IVZ worth?
Undervaluedlow confidenceOur blended fair-value estimate for Invesco Ltd. is $33.31 per share, versus a market price of $27.91. That implies 19% of upside — a margin of safety of about 16%.
Fair Value
$33.31
Current Price
$27.91
Upside
+19%
Margin of Safety
16%
How we get there
Discounted cash flow
Discounts projected free cash flow back to today.
Dividend discount
Discounts the future dividend stream back to today.
At today's price, the market is pricing in about 2.9% annual free-cash-flow growth. We model 14.9% — below our estimate, leaving room for upside if the business executes.
Assumptions: 12.0% discount rate (CAPM), 14.9% stage-1 growth, 2.5% terminal growth, -$1.47 EPS, $0.86 annual dividend. Updated weekly.
Fair-value estimates are model output for educational purposes only — not investment advice or a price target.
IVZ Dividend Safety Score
Safe
SmarterDividends' proprietary score, backtested against which dividends were actually cut over 15+ years (0.78 AUC). It blends a validated cut-risk model (growth streak, cut history) with current payout, cash-flow and debt. Higher is safer · not investment advice.
Dividend Growth
Total dividends per share by year
Dividend History
| Ex-Date | Pay Date | Amount | Type |
|---|---|---|---|
| May 15, 2026 | — | $0.2150 | regular |
| Feb 13, 2026 | — | $0.2100 | regular |
| Nov 14, 2025 | — | $0.2100 | regular |
| Aug 14, 2025 | — | $0.2100 | regular |
| May 14, 2025 | — | $0.2100 | regular |
| Feb 14, 2025 | — | $0.2050 | regular |
| Nov 14, 2024 | — | $0.2050 | regular |
| Aug 16, 2024 | — | $0.2050 | regular |
| May 13, 2024 | — | $0.2050 | regular |
| Feb 15, 2024 | — | $0.2000 | regular |
| Nov 9, 2023 | — | $0.2000 | regular |
| Aug 10, 2023 | — | $0.2000 | regular |
| May 8, 2023 | — | $0.2000 | regular |
| Feb 15, 2023 | — | $0.1880 | regular |
Income Calculator
At $0.86 / yr per share