
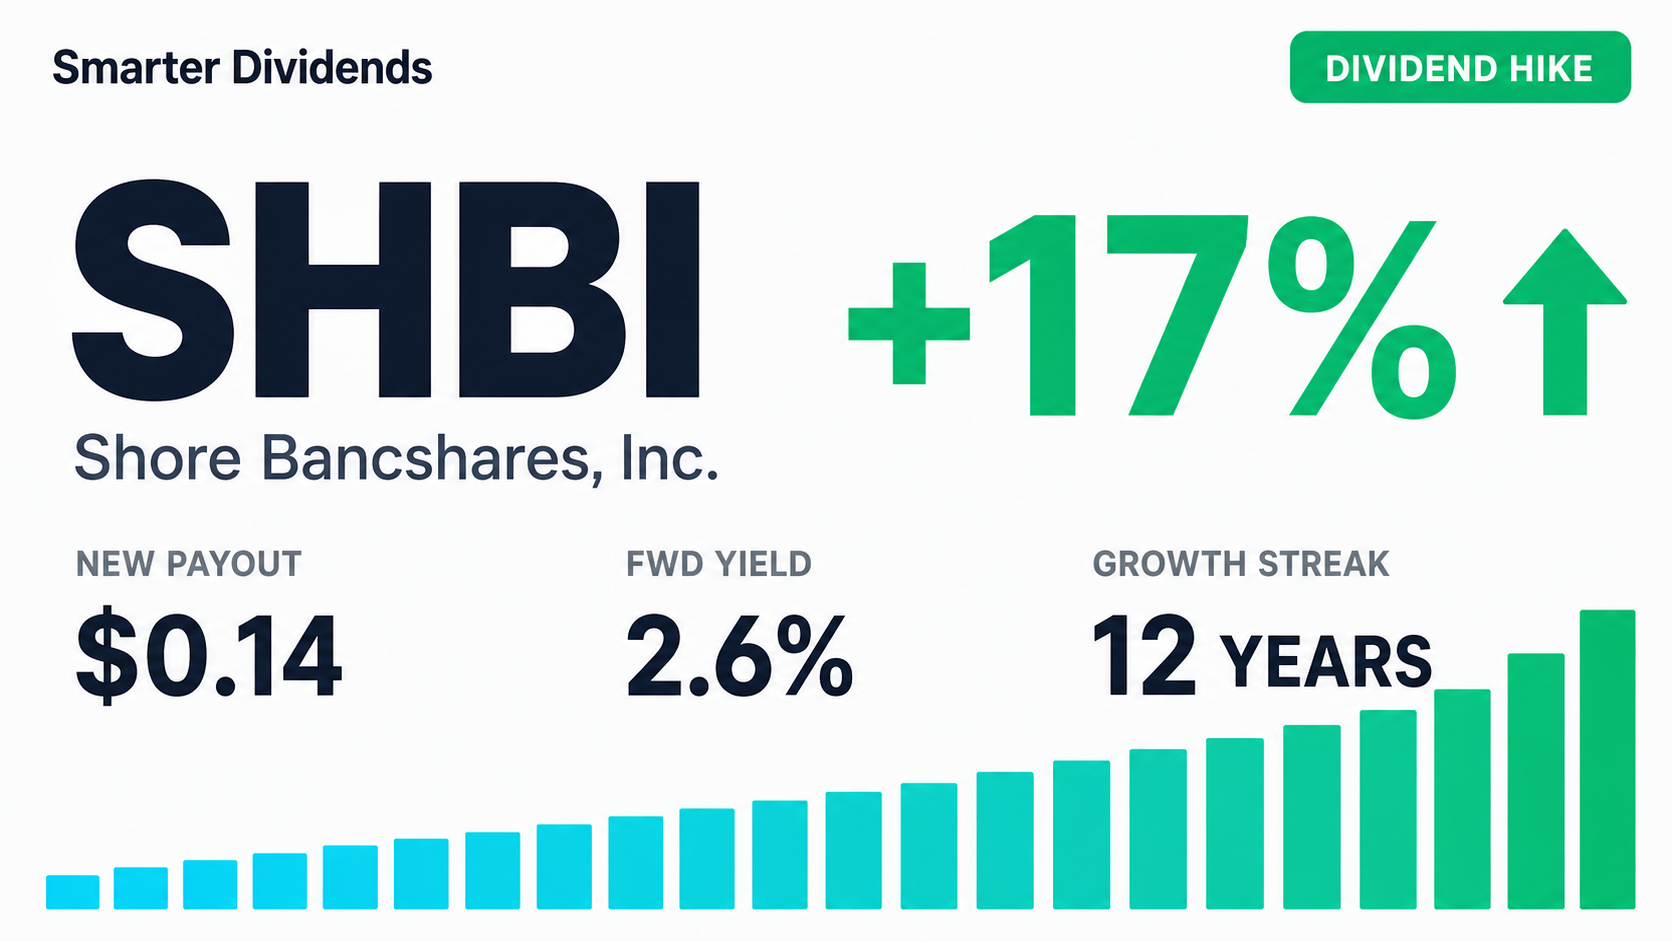
Shore Bancshares, Inc.
SHBIFinancial Services · Stock · quarterly payer
Forward Yield
2.58%
Annual Dividend
$0.56
Payout Ratio
26%
5-Yr Growth
0.0%
Ex-Date
Jun 3, 2026
Frequency
Quarterly
Is SHBI a good dividend stock?
YesShore Bancshares, Inc. (SHBI) pays a quarterly dividend yielding 2.58% ($0.56/yr), with 12 years of growth and a dividend-safety grade of A. It scores well across payout coverage, growth history and safety — a dependable income holding.
Advantages
- 12 consecutive years of dividend growth
- Comfortable payout ratio (26%)
- Top-tier dividend safety score
Risks
- Cut its dividend in 2011
Key Data
- Dividend Yield
- 2.58%
- Payout Ratio
- 26%
- Annual Dividend
- $0.56
- 5-Yr Avg Growth
- 0.0%
- Ex-Dividend Date
- Jun 3, 2026
- Years of Growth
- 12
- Frequency
- quarterly
- Beta
- 0.84
- Market Cap
- $725.0M
- P/E Ratio
- 11.5
- 5-Yr Total Return
- 25%
- 52-Week Range
- $14.35 – $21.17
- Dividend Safety
- A · 81/100
- Ever Cut?
- Yes (2011)
Frequently Asked Questions
SHBI Price — Last 12 Months
Daily close
Price Return
1 Year
+34%
3 Years
+82%
5 Years
+25%
52-Week Range
$14.35 – $21.17
Price change over each period (excludes dividends). Past performance doesn't guarantee future results.
What is SHBI worth?
Undervaluedlow confidenceOur blended fair-value estimate for Shore Bancshares, Inc. is $42.72 per share, versus a market price of $21.67. That implies 97% of upside — a margin of safety of about 49%.
Fair Value
$42.72
Current Price
$21.67
Upside
+97%
Margin of Safety
49%
How we get there
Discounted cash flow
Discounts projected free cash flow back to today.
Dividend discount
Discounts the future dividend stream back to today.
Earnings multiple (Graham)
Graham's earnings-multiple formula, anchored to bond yields.
At today's price, the market is pricing in about -4.9% annual free-cash-flow growth. We model 20.0% — below our estimate, leaving room for upside if the business executes.
Assumptions: 8.5% discount rate (CAPM), 20.0% stage-1 growth, 2.5% terminal growth, $1.88 EPS, $0.56 annual dividend. Updated weekly.
Fair-value estimates are model output for educational purposes only — not investment advice or a price target.
SHBI Dividend Safety Score
Very Safe
SmarterDividends' proprietary score, backtested against which dividends were actually cut over 15+ years (0.78 AUC). It blends a validated cut-risk model (growth streak, cut history) with current payout, cash-flow and debt. Higher is safer · not investment advice.
Dividend Growth
Total dividends per share by year
Dividend History
| Ex-Date | Pay Date | Amount | Type |
|---|---|---|---|
| Jun 3, 2026 | — | $0.1400 | regular |
| Mar 4, 2026 | — | $0.1200 | regular |
| Nov 13, 2025 | — | $0.1200 | regular |
| Aug 11, 2025 | — | $0.1200 | regular |
| May 12, 2025 | — | $0.1200 | regular |
| Feb 13, 2025 | — | $0.1200 | regular |
| Nov 12, 2024 | — | $0.1200 | regular |
| Aug 12, 2024 | — | $0.1200 | regular |
| May 15, 2024 | — | $0.1200 | regular |
| Feb 9, 2024 | — | $0.1200 | regular |
| Nov 16, 2023 | — | $0.1200 | regular |
| Aug 3, 2023 | — | $0.1200 | regular |
| May 11, 2023 | — | $0.1200 | regular |
| Feb 16, 2023 | — | $0.1200 | regular |
Income Calculator
At $0.56 / yr per share